Biomarker monitoring
Longetic is a B2C HealthTech app on the App Store that brings lab results and medical records together in one structured picture.
This feature’s goal is to be one place for every biomarker: users upload their lab results and doctor’s notes, and the app sorts them by biomarker, body system, and doctor’s visit.
I worked on the flows, the information architecture, and the UI, seeing design through to development. Everything shown here shipped, except where noted.
What it does
- Collects lab results and doctor’s notes from a photo or a file via phone, web upload, or a forwarded email.
- Matches each biomarker across files into one history.
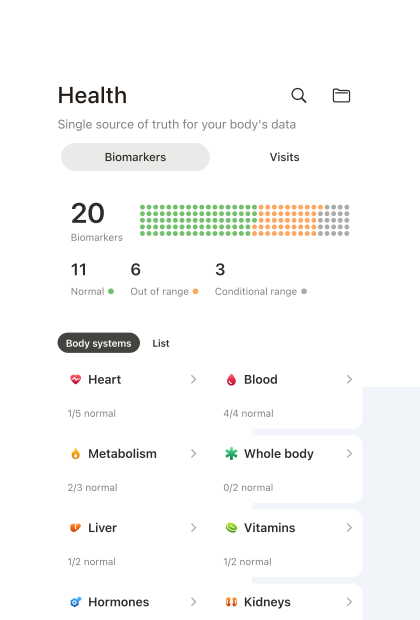
- Groups biomarkers into ten body systems.
- Shows stats for each uploaded file and across all files.
- Gives background on each biomarker: what affects it, what to track over time, and what to ask your doctor.
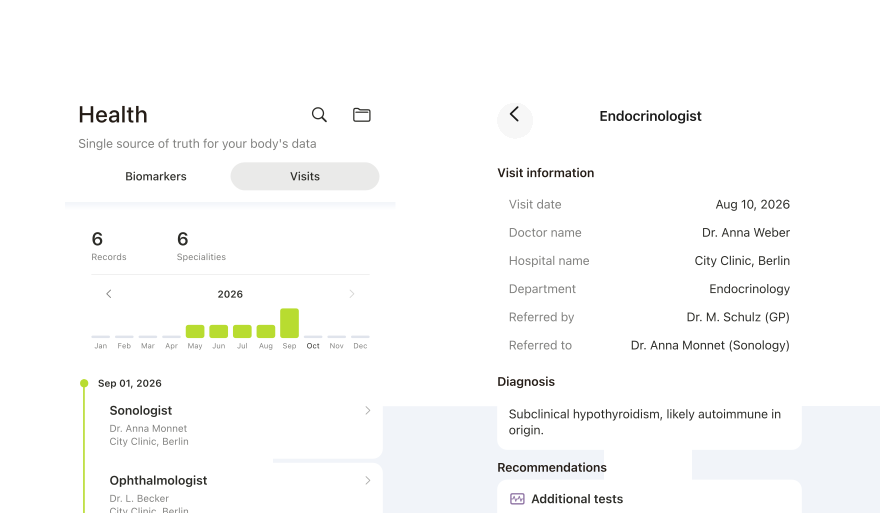
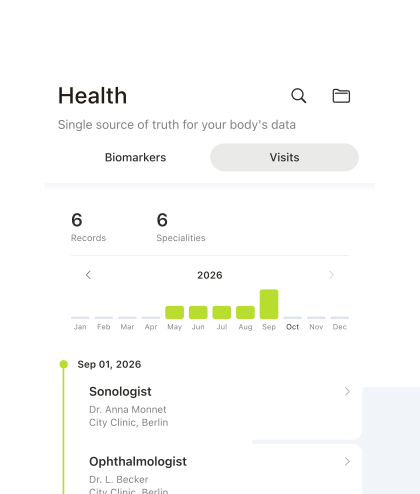
- Arranges doctor’s visits on a timeline.
What it does not do
- Does not compare a value to a general reference range. It uses only the range printed by the lab.
- Does not compare a user to other users. It shows the user only their own results.
- Does not diagnose or recommend.
Product decisions
Out of range is soft orange, not red
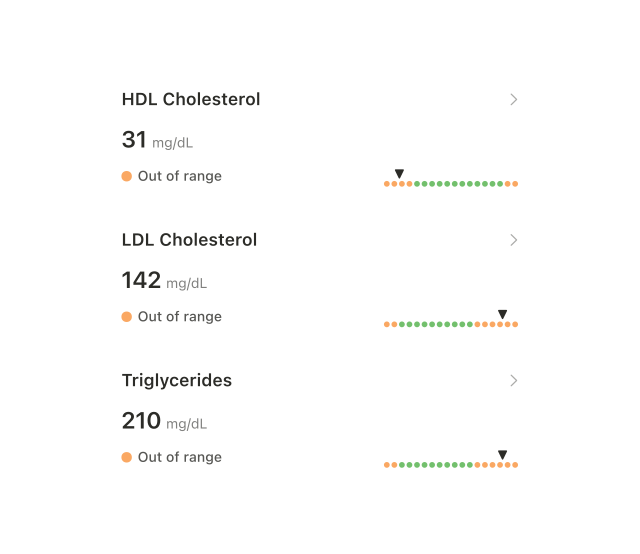
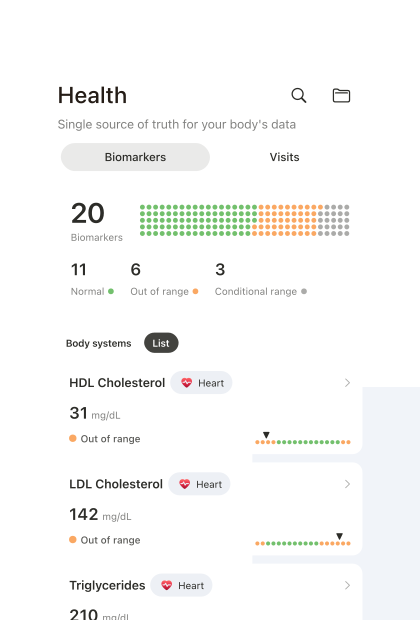
Red was rejected as alarming. A result outside the range is soft orange, with a marker on a scale of the lab’s printed range.
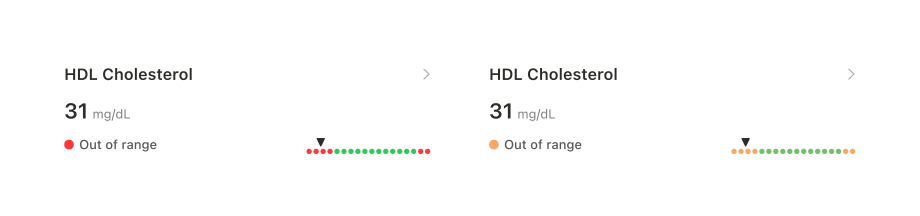
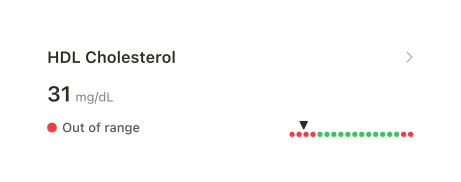
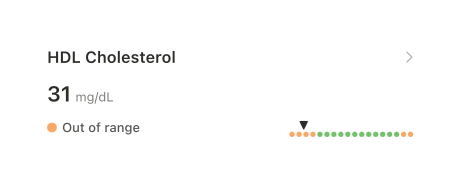
The label says “Out of range”, not “High” or “Low”. Results can fall above or below a range, and separate categories make sorting harder. One label keeps the categories consistent, and the marker shows which side of the range the result falls on.
Upload is where the user’s documents are
Upload started with a file or a photo on the user’s phone.
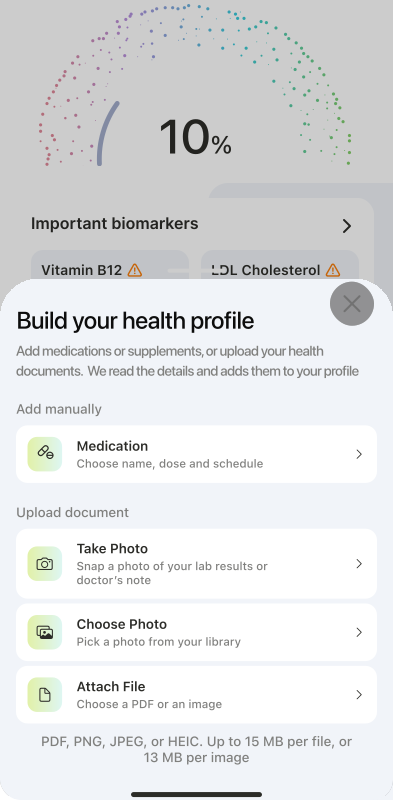
After asking potential users where they keep their health files, we found that keeping them on the phone was not common. So we added two more routes: web upload from a desktop, and an address users can forward lab emails to. Documents from every route appear in the app.
Body systems come before a full list
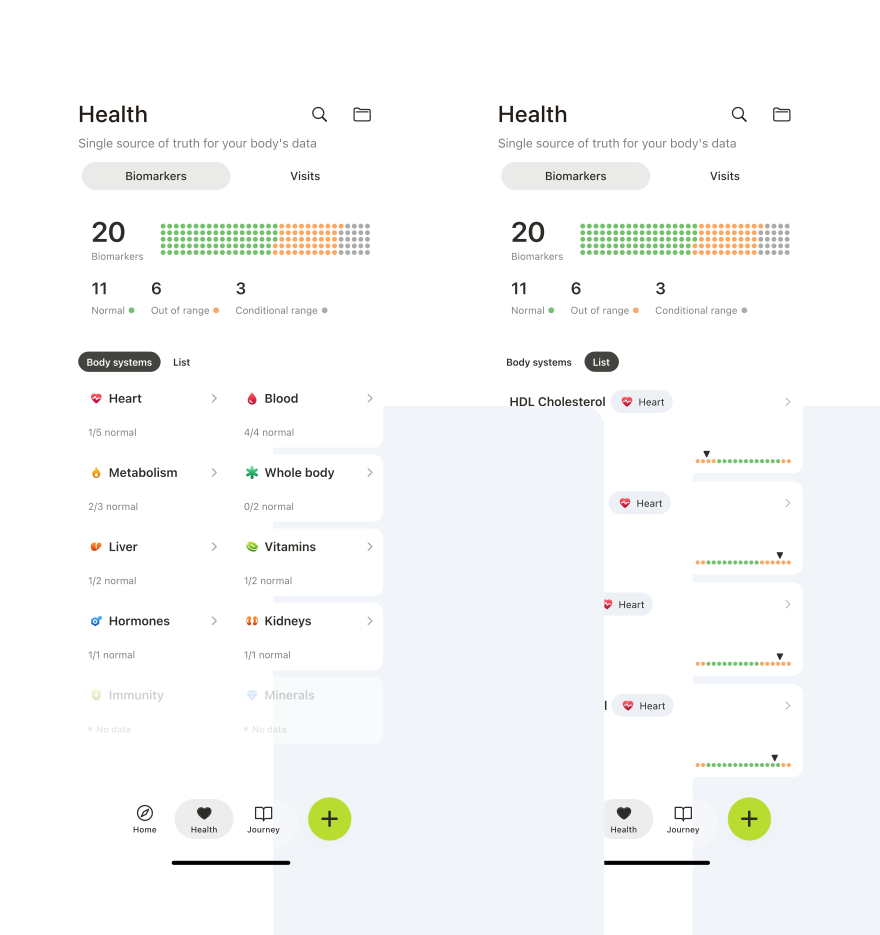
A long list of biomarker names says little to most users. Ten body systems divide the same results into categories users can understand: vitamins, hormones, blood, heart, kidneys, liver, minerals, whole body, metabolism, and immunity.
Some users will want to see everything at once without opening each system. A plain list covers this as a secondary view. It is ready for development and has not shipped yet.
Results are listed, not charted
A biomarker page shows the latest result with its source file and date, the results from other files, and the background on that biomarker.
The results are not put on a chart. Within one biomarker, each result can come from a different lab, with its own reference range and calculation method, so a single line through them would not be accurate. Instead, each result is shown with its own range, file, and date.
Matching relies on a canonical biomarker table built by the team. If no match is found, the biomarker stays as printed, without a description. If a value is read incorrectly, the user can write to support to have it corrected.
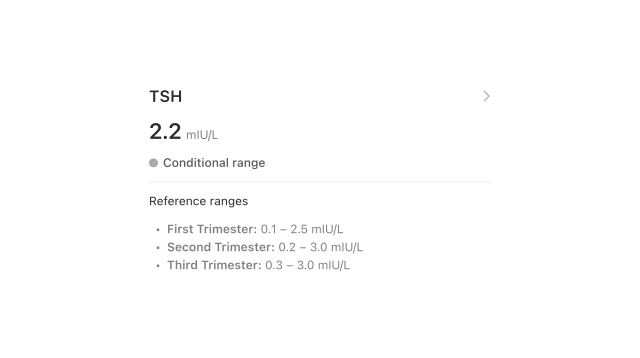
A conditional range shows its conditions
Some biomarkers have different lab ranges depending on factors such as menstrual cycle day, pregnancy, or underlying conditions.
These get a grey status and a list of the ranges as printed, with no scale.
Doctor’s visits stay neutral
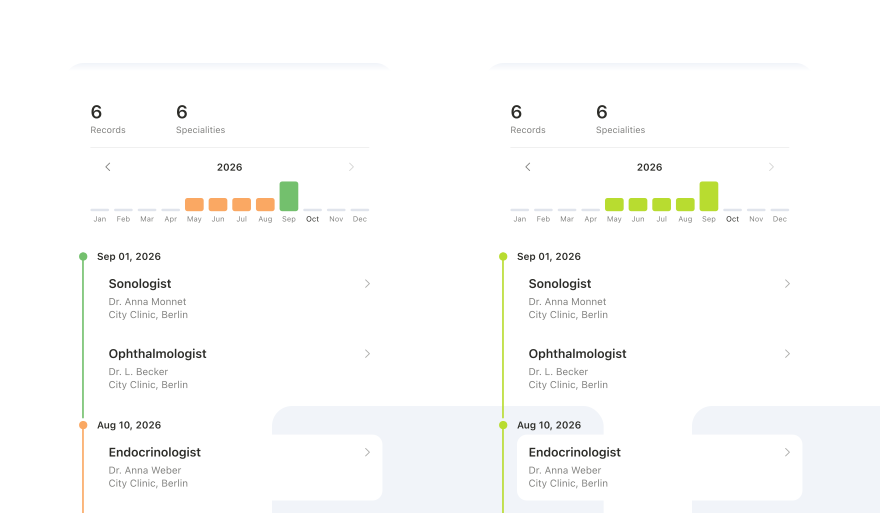
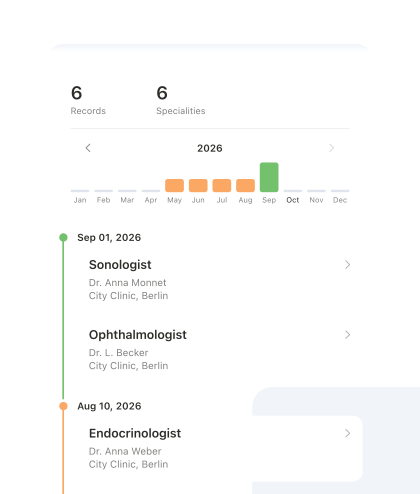
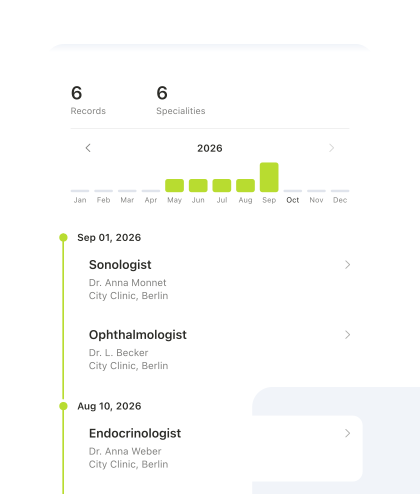
Doctor’s notes become a timeline of visits, with a graph showing when in the year each one happened.
Biomarkers use system orange and green. The visits graph uses the brand colour instead: seeing a doctor is neither good nor bad, so the graph neither praises nor punishes it.
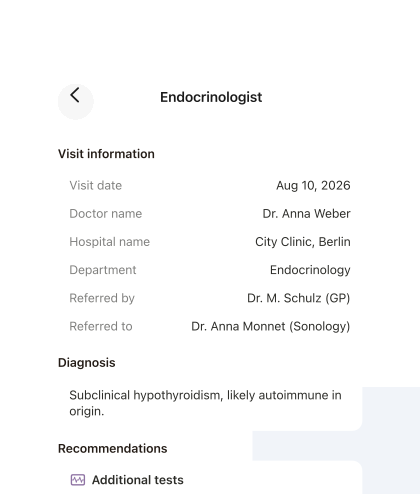
Inside a visit, the note is reduced to what matters: when and where the appointment happened, diagnoses, recommendations, prescriptions, and follow-ups. All of it appears as printed.
Status
Shipped in summer 2026. The plain list is ready for development.
Next case: Medication tracking